

By Matt Miner
August 15, 2019
Dear Clients,
First, THANK YOU for your business with PLC Wealth Management! We are honored to serve as your advisors and to walk through life with you.
Second, we think today is a good day to talk with you about jumpy stock markets, falling bond yields, and our thoughts regarding the US economy. Our letter wraps up with actionable advice for you to implement immediately. Pretty exciting, right?
As I prepared to join my family for dinner last evening, I received a forwarded email. According to a tweet by advisor Michael Batnick, yesterday was the 307th time that the Dow fell 3% or more in a single day, over the course of the last 100 years. To see the folks on CNBC jumping up and down, wild eyed and foaming at the mouth, you could be forgiven for imagining that the entire US economy been vaporized.
Volatile Stock Markets
On average a downward move of the magnitude we experienced yesterday happens 3.07 times each year. Equity markets have been mostly placid over the last decade, and yesterday’s market decline was the first drop of that size in 2019. But if we simply achieve historically average volatility, we can expect two more moves of the same size before we celebrate New Year’s Day 2020! Said differently, drops of 3% come around slightly more than three times as often as Christmas.
For a different comparison, UNC and Duke always get invited to the NCAA Men’s Basketball Tournament. In each program’s history, UNC has played 160 NCAA tournament games and Duke has played 147 NCAA tournament games. Coincidentally, the Dow Jones Industrial Average has declined 3% or more in a single day in the last 100 years the same number of times as the two most storied programs in college basketball have played a game in the NCAA tournament: Many, many, times! Stock market volatility is table steaks. It’s why investors expect to earn a positive return for investing in stocks.
The Russell 3000, one of our preferred index comparisons, was down 2.89% yesterday and is down 4.85% for the month. No one likes that. But the same index is up 14.63% in 2019, 9.53% per year on a rolling five-year basis, and 13.20% per year on a rolling ten-year basis (ftserussell.com as of 8/14/2019 market close).
The stock market can be a rough ride, but it has reliably propelled investors’ wealth upward over time. The chart below shows the growth of one dollar from 1970 to 2017 invested in one-month T-Bills, the S&P 500 Index, and in a globally diversified stock portfolio, similar to PLC Wealth’s equity investment style.
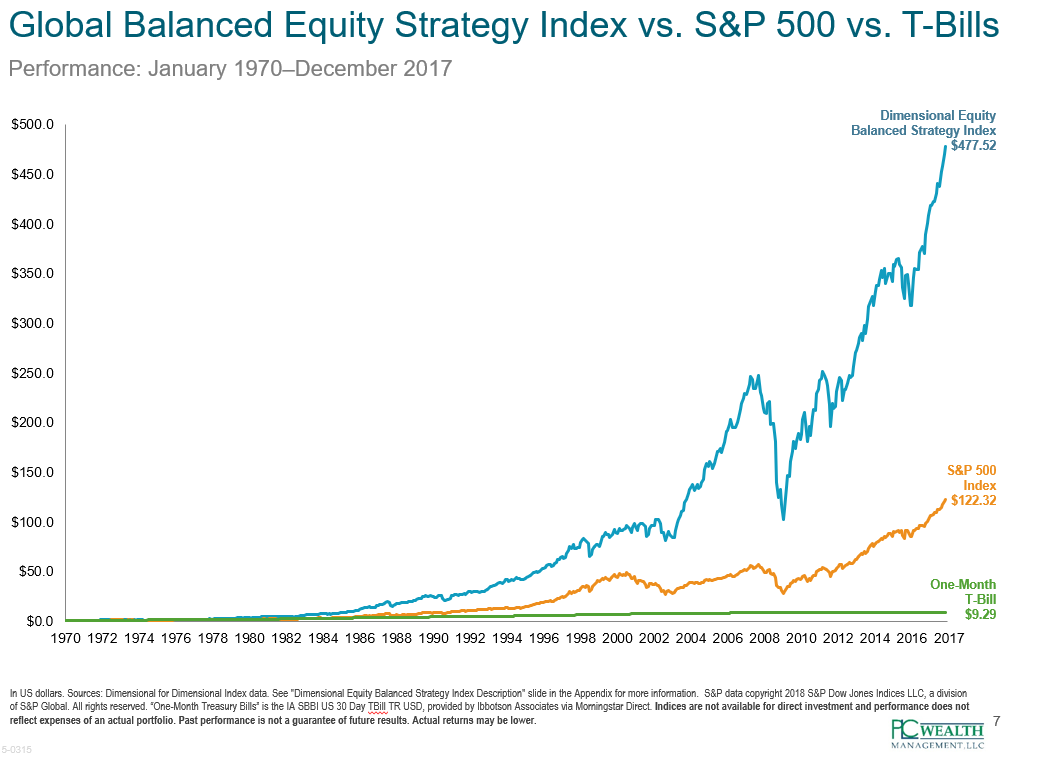
Friends and neighbors, you only get hurt on a roller coaster if you jump off.
Falling Bond Yields
It is true that bond yields have fallen, meaning that money invested in the bond market today earns less interest than it did at this time last year. This has resulted in strong appreciation of bond funds (bond prices move in an inverse relationship to bond yields). For example, DFAPX, an investment-grade bond fund, has appreciated 7.81% in 2019, something I did not expect as we entered this year. On the other hand, falling rates mean that maturing bonds will be reinvested at lower interest rates than bonds that matured in the recent past. It also means that interest rates earned on assets like money market funds, certificates of deposit, annuities, and savings accounts have been reduced.
The Yield Curve
What about the ever-famous inverted yield curve? Once you finish this article you’ll be able to amaze your friends and confound your enemies because you’ll know the answers to questions like, “What is a yield curve?” and “What is an inverted yield curve?” and “What does a yield curve inversion mean?” and most meaningfully, “What should I do?”
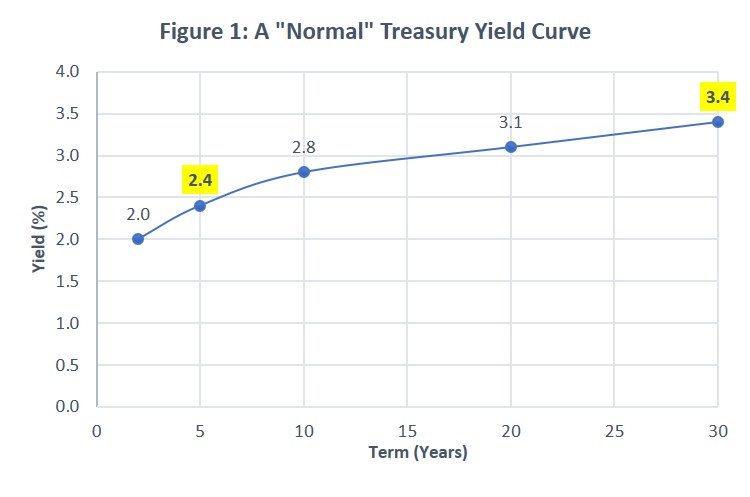
First, a yield curve plots the returns investors expect on debt over different periods of time – for example one, five, ten, and thirty years. Investors normally demand to be paid more to loan their money for longer periods. You may have experienced this as a consumer: 30-year mortgage rates are higher than 15-year mortgage rates. This is because the longer the loan, the greater the investor’s exposure to the vagaries of inflation, the risk that the borrower fails to repay, and the risk that the money is locked up at a time the investor wants liquidity. In the graphic below, the August 2018 yield curve (the line with the gray diamonds) is the most “normal” looking, even though the rates are low by historic standards.
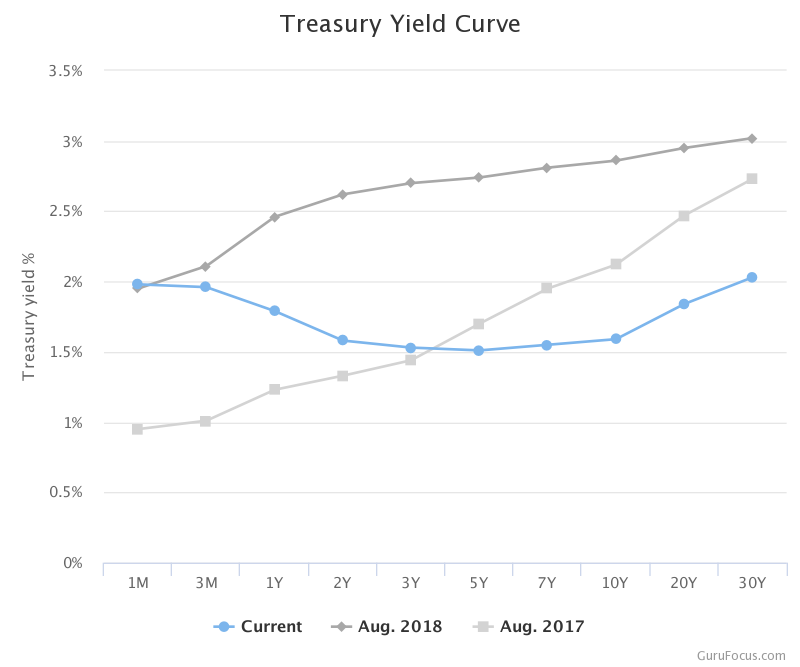
Second, an inverted yield curve like the blue line with dots, labeled “Current” in the graph above, means that investors demand 2% to loan to the US government for one year, but only ~1.65% to loan for ten years. How can this be? The inverted yield curve signals that bond investors expect poor economic performance resulting in low interest rates over that time period.
Third, an inverted yield curve has accurately predicted economic recession (two or more quarters of negative growth) or an economic slowdown (a reduction in the growth rate) with 100% accuracy going back to the Eisenhower administration. The predictive value of the inverted yield curve is particularly potent if the inversion lasts for more than one full quarter which is the case as I write you this letter.
Here’s the unvarnished truth: A recession is coming. A recession is always coming. What we don’t attempt to do is predict when the recession will arrive. The fact that a recession is coming is part of your plan. When you work with an advisory firm like PLC Wealth, your plan includes the expectation of recession. It’s kind of like knowing you’ll need to replace your car. You don’t know exactly when you’ll need a new car, but you’ll need one sometime. By planning with PLC Wealth, you have prepared for recession.
Cam Harvey, a terrific professor at my business school alma mater – Duke’s Fuqua School of Business – was quoted yesterday by WRAL saying, “Maybe this is not the right time to max out your credit card…Maybe it’s not the right time to take the vacation with your family that is going to overextend you.” Professor Harvey goes on to recommend you “[do] 100% effort at your job.”
At PLC Wealth we never recommend you max out your credit card. Instead, we recommend you negotiate discounts and pay cash!
We love vacations, but we don’t recommend you overextend yourself to take one. Go camping if that is what your budget supports!
Putting in 100% effort at work is timeless advice your dad gave you, too.
Call to Action
What should you do to prepare for the coming recession? For that matter, what should you do to prepare for the coming prosperity? The advice does not change. Do excellent work. Live on less than you make. Invest the difference wisely. Make a good tax plan. Bless your family with a thoughtful estate plan. Prepare for catastrophe with suitable insurance and emergency funds. Care for your health. Spend time with the people you love. Live according to your values. Be kind.
If you have questions about market volatility, bond yields, or the coming recession, give us a call. We are here to help with any topic where life meets money. Once again, thank you for your business with PLC Wealth Management.