


August 27, 2018
By Josh Self
The yield curve is flattening (or growing steeper)! … Yield curve spreads are widening (or narrowing)! … The yield curve has inverted (or normalized)!
Headline-grabbing yield curve commentary somehow sounds important, doesn’t it? But what is a yield curve to begin with, and what does it have to do with you and your investments?
A Tour Around the Curve
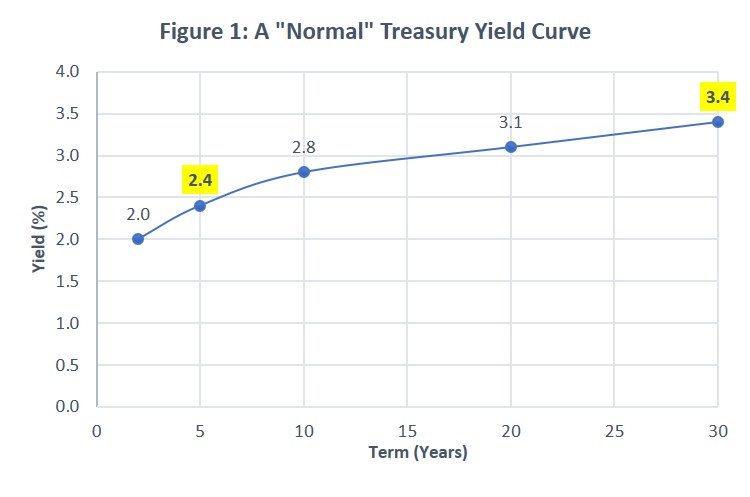
Yield curves typically depict the various yields across the range of maturities for a particular bond class. For example, Figure 1 would inform us that a U.S. Treasury bond with a 5-year maturity was yielding 2.4% annually, while a 30-year Treasury bond was yielding 3.4%.
Bond class – A bond class or type is typically defined by its credit quality. Backed by the full faith of the U.S. government, U.S. Treasury yield curves are among the most frequently referenced, and often the high-quality benchmark against which other bond types are compared – such as municipal bonds, corporate bonds, or other government instruments.
Term/Maturity – The data points along the bottom X axis of a yield curve represent various terms available for a bond class. The term is the length of time you’d need to hold a bond before your loan matures and you should receive your initial investment back.
Yield – The data points along the vertical Y axis represent the interest rate, or yield to maturity currently being offered – such as 2% per year, 3% per year, and so on. The yield curve for any given bond class changes every time its yields change … which can be frequently.
Spread – The spread is the difference between the annual yields on two bond maturities. So, in Figure 1, there’s a 1% spread between 5-year (2.4%) and 30-year (3.4%) Treasury bond yields.
Define “Normal”
Next, let’s look at the curve itself – i.e., the line that connects the data points just discussed.
The shape of the yield curve helps us see the relationship between various term/yield combinations available for any given bond class at any given point in time.
Just as our body temperature is optimal around 98.6°F (37°C), there’s a preferred equilibrium between bond market terms and yields. “Normal” occurs when short-term bonds are yielding less than their longer-term counterparts. Under normal economic conditions, investors expect to be compensated with a term premium for taking the incremental risk of owning longer maturities. They’re accepting more uncertainty about how current prices will compare to future possibilities. Conversely, they’ll accept lower rates for shorter-term instruments, offering greater certainty.
At the same time, evidence suggests there’s often a law of diminishing returns at play. Typically, the further out you go on the yield curve, the less extra yield is available. Thus, Figure 1 depicts a relatively normal yield curve, with a bigger jump to higher returns early in the curve (a steeper spread) and a more gradual ascent (narrower spread) as you move outward in time.
Variations on the Curve
If Figure 1 depicts a normal yield curve, what happens when things aren’t so normal, which is so often the case in our fast-moving markets?
The shape of the yield curve essentially reflects evolving investor sentiments about unfolding economic conditions.
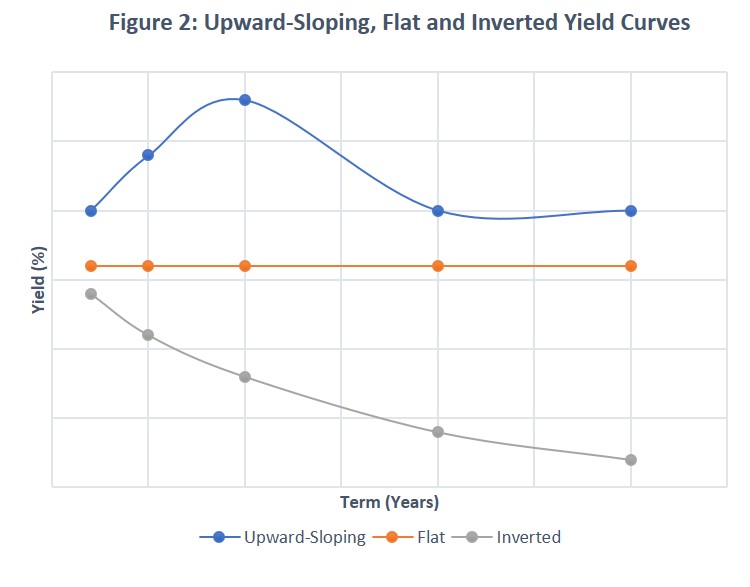
In short, expectations theory suggests that the yield curve reflects investor expectations of future interest rates at any given point in time. Thus, if investors in aggregate expect rates to rise (fall), the yield curve will slope upward (downward). If they expect rates to remain unchanged, it will be flat. Figure 2 depicts three different curve shapes that can result.
You, the Yield Curve and Your Investments
It’s rare for the yield curve to invert, with long-term yields dropping lower than short-term. But it happens. This happens when the Federal Reserve (or another country’s central bank) tightens monetary policy. The result of tightening monetary policy is to drive up short-term rates to fight inflation. An inverted yield curve is often followed by a recession – although not always, and not always universally.
Does this mean you should head for the hills if the yield curve inverts or takes on other “abnormal” shapes? Probably not. At least not in reaction to this single economic indicator.
As with any other data source, bond yield curves are best employed to inform and sustain your durable, evidence-based investment plans, rather than to tempt you into abandoning those plans every time bond rates make a move. This typically means investing in bonds that offer the highest yield for the least amount of term, credit and call risk. (Call risk is realized if the bond issuer “calls” or pays off their bond before it matures, which usually forces the bond’s investors to accept lower rates if they want to remain invested in the bond market.)
The yield curve is an important tool for determining how to efficiently execute this greater goal. It helps explain why we typically recommend holding only high-quality bonds, minimizing call risk. We seek to strike a middle ground between short-term versus long-term bonds. Similar principles apply, whether investing directly in individual bonds or via bond funds.
In short, it’s good to understand the yield curve, and then to look past it – toward your long-term financial goals. Please contact us at PLC Wealth if you’d like to talk about how fixed income/bond investing best fits into your investment plan.